In this article, we will be doing the data analysis of Covid-19 cases in India. I’m making this article just to show you how you can use Python Programming in real-world situations.
So, we’ll analyze the Covid-19 cases in India and try to visualize the data using matplotlib and seaborn. Let’s begin.
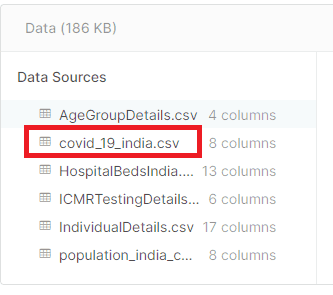
For doing this project, I’ve found a dataset called “Covid-19 in India” on Kaggle. You can find it out from here.
Go to the link given above and download the covid_19_india.csv file.
Now, open up a jupyter notebook, and let’s start coding.
First of all, we need to import pandas and read the CSV file.
import pandas as pd
data = pd.read_csv('Downloads/covid_19_india.csv')
data.head()
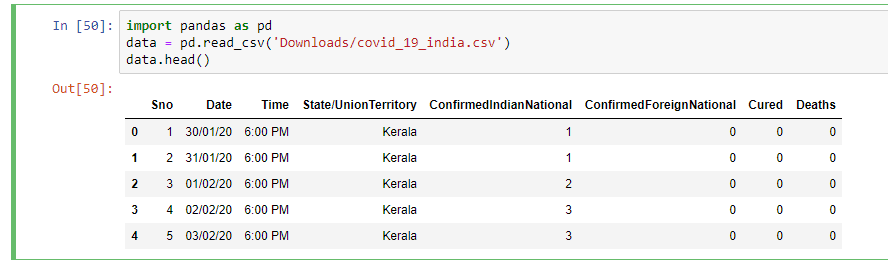
When you look at this dataset, we can see that the number of confirmed cases are put into two columns, viz., ConfirmedIndianNational and ConfirmedForeignNational.
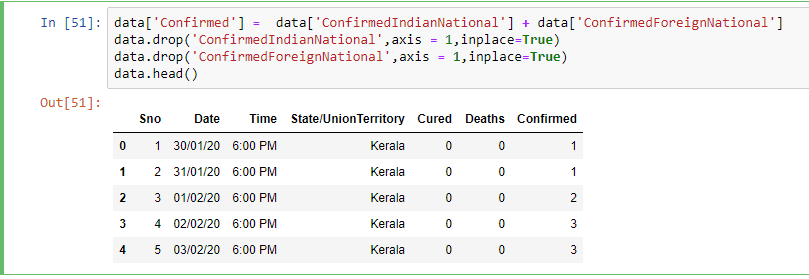
For simplicity, we need to combine the two into one column. So, let’s do that.
data['Confirmed'] =  data['ConfirmedIndianNational'] + data['ConfirmedForeignNational']
data.drop('ConfirmedIndianNational',axis = 1,inplace=True)
data.drop('ConfirmedForeignNational',axis = 1,inplace=True)
data.head()
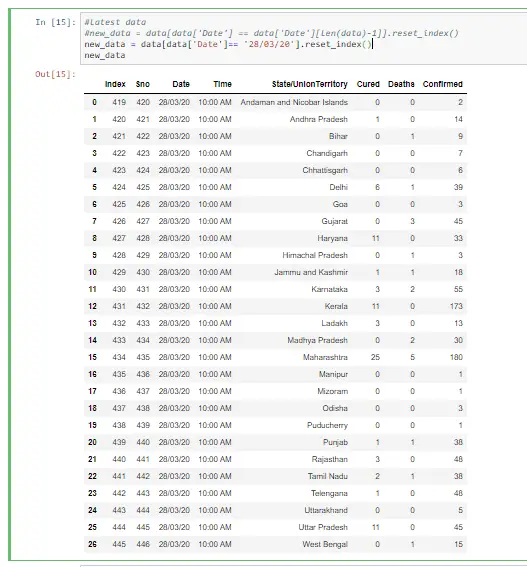
As you can see, this dataset lists out all the new cases that are appearing in India. We are going to analyze the data Statewise. So, let’s create a new data frame with the latest data.
I’m doing this project on 28th March, and hence the latest data available for me was on 28/03/2020 10:00 AM. So, I set the date to be 28/03/2020.
We will use the reset_index(), which is a pandas method to reset the index of a Data Frame. reset_index() method sets a list of integers ranging from 0 to length of data as the index.
new_data = data[data['Date']== '28/03/20'].reset_index()
new_data
We got the latest data Statewise. Now, let’s try to plot this data into some graphs to visualize the data. For visualization, we need matplotlib and seaborn modules of Python. So import those modules.
import matplotlib.pyplot as plt
import seaborn as sns
Now, let’s group the data based on State/UnionTerritory. We will plot the data based on the descending order of the number of confirmed cases.
First, we’ll plot a bar chart using the barplot method of the seaborn module.
grouped_data = new_data.groupby('State/UnionTerritory')['Cured', 'Deaths', 'Confirmed'].sum().reset_index()
temp = grouped_data.sort_values(by='Confirmed', ascending=False)
data = temp[['State/UnionTerritory','Confirmed','Cured','Deaths']]
sns.set_color_codes("muted")
plt.subplots(figsize=(13,7))
sns.barplot(x="Confirmed", y="State/UnionTerritory", data=data,label="Total", color="green")
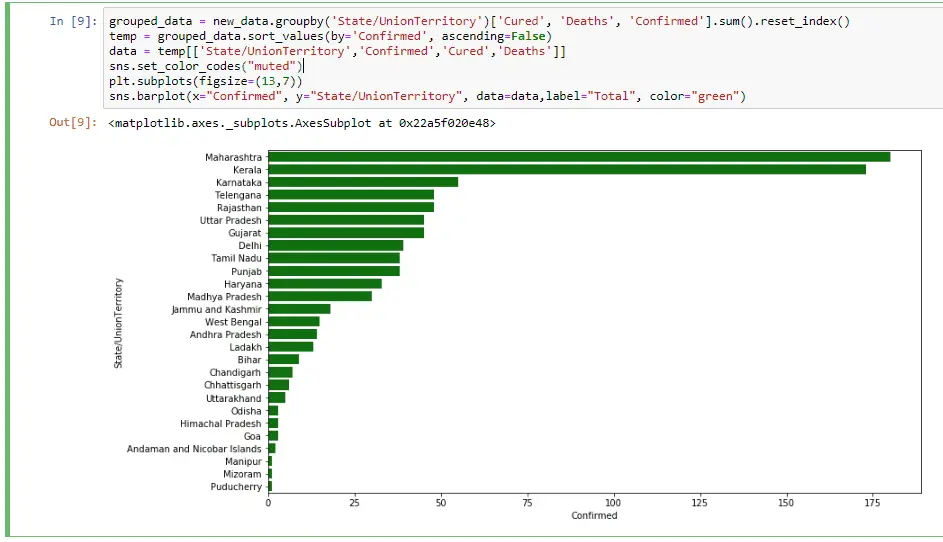
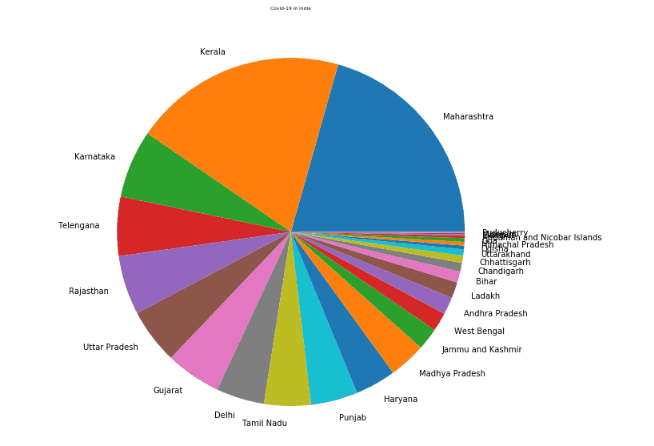
We got a nice bar chart showing the number of confirmed cases in India. Now, let’s create a pie chart of the same using the pie() method of the matplotlib module.
x=temp['Confirmed']
labels=temp['State/UnionTerritory']
plt.figure(figsize=(16,10))
plt.title("Covid-19 in India", fontsize=6)
plt.pie(x,labels=labels)
That’s it. You can play around with the data as you wish. I would urge you to analyze this dataset further and do whatever you can with it.
You can check out this Github repository if you want to see my notebook.
If you want the international data of Covid-19 cases, you can check out this link.
I hope this article was useful to you. Let me know your thoughts in the comments section below.
I would appreciate it if you would be willing to share this article. It will encourage me to create more useful tutorials like this.
Stay safe. Happy Coding!
2 thoughts on “Covid-19 Data Analysis Using Python”
Leave a Reply to Ashwin Joy Cancel reply
Recent Posts
Modular programming is a software design technique that emphasizes separating the functionality of a program into independent, interchangeable modules. In this tutorial, let's understand what modular...
While Flask provides the essentials to get a web application up and running, it doesn't force anything upon the developer. This means that many features aren't included in the core framework....
")
new_data = data[data[‘Date’] == data[‘Date’][len(data)-1]].reset_index()
by this line how the data of only 28/03/2020 comes in new_data ?
I used that line of code to select the latest date. If you are confused with it, you can use the following line also: new_data = data[data[‘Date’]== ’28/03/20′].reset_index()