Data visualization is a very important field in modern computer science and several libraries and modules of Python can simplify the tasks. One such data visualization library is seaborn.
In this article, I want to introduce you to this amazing library and show you what it can do at the basic level.
Seaborn is a data visualization library of Python built on top of matplotlib. If you don’t know what matplotlib is, I’ve written an introductory guide to matplotlib. Click here to check that out.
Seaborn works similarly to matplotlib but has several extra features and capabilities. It provides a high-level interface for drawing attractive statistical graphics. Seaborn also comes up with a lot of preload datasets, which can help us to understand visualization easily.
Some of the datasets in seaborn include titanic, car crashes, iris, flight, planets, exercise, diamonds, brain networks, etc. You can check out this GitHub repository for more information. We will be using the car crashes dataset in this article.
Installation
Seaborn library is dependent on some other libraries, such as numpy, scipy, pandas, and matplotlib. You need to have these libraries installed on your system before you install seaborn.
To install seaborn, you can open your command prompt and type in the following command.
pip install seaborn
Now, let’s take a look at some of the features of seaborn by doing an example project.
Basics of Seaborn
Launch the jupyter notebook application and open up a new notebook. If you are using some other IDEs and you know what you’re doing, then go ahead. I prefer the jupyter notebook for data science-related work.
To create a new notebook, click on New -> Python 3. Rename the file. Now, let’s start coding.
First of all, import the matplotlib and seaborn libraries into the notebook. I usually import seaborn as sns since it is a common way of doing among developers.
import seaborn as sns
import matplotlib.pyplot as plt
Now, let’s use the car crashes dataset. We can use the load_dataset() method for loading a dataset.
data = sns.load_dataset('car_crashes')
If you want to see how the data looks like, use the head() method to see a small part of the data.
data.head()
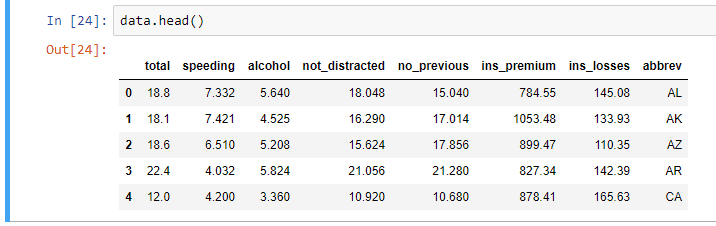
As you can see, the dataset contains several columns and some interesting data.
Now, let’s plot a basic graph in seaborn. We’ll plot a distplot first, which flexibly plots a univariate distribution of observations. Let’s use the distplot() method and pass the ‘total’ column as a parameter.
sns.distplot(data['total'])
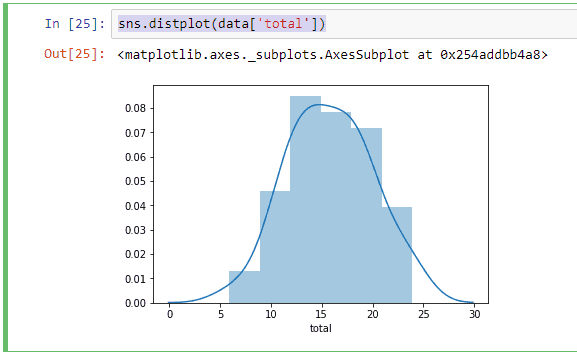
You can set different parameters and use this method as you want. Click here to learn more about this method.
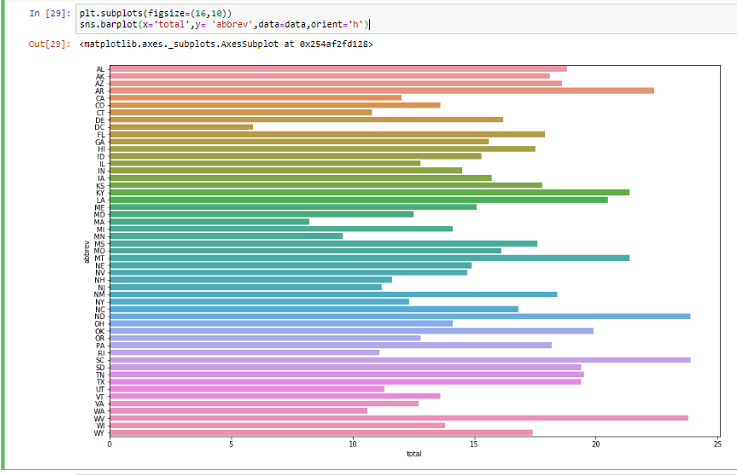
Now, let’s see how we can plot a bar chart. For that, we have a method called ‘barplot’ in seaborn. We can pass on two columns as X-axis and Y-axis.
Let’s plot a bar chart with X-axis as the total number of accidents and the Y-axis as the states (in the United States).
plt.subplots(figsize=(16,10))
sns.barplot(x='total',y= 'abbrev',data=data,orient='h')
Here, I used the subplots method of matplotlib to set the size of the chart.
Now, let’s move on to another plot. The jointplot method is used to draw a plot of two variables with bivariate and univariate graphs.
For example, let’s put two parameters and plot a graph to see how it looks.
sns.jointplot(x='total',y='alcohol',data=data)
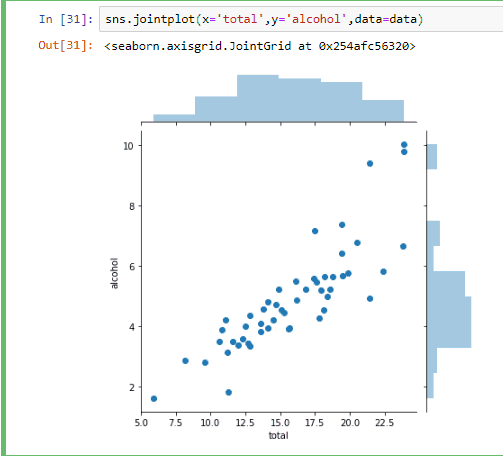
You may not understand what this graph means. But, these kinds of plots are useful in finding the relationship between different variables in several situations. Check out this article to learn more about the jointplot.
Yet another important plot in seaborn is the pairplot. A pairplot helps to plot a pairwise relationship in a dataset.
sns.pairplot(data)
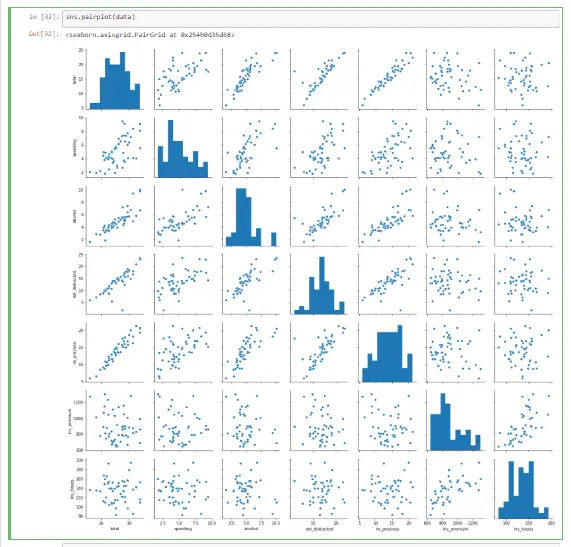
Don’t feel overwhelmed by seeing these plots. You don’t need to learn how this works as of now. I just used this method here to show you the possibilities of this library.
Apart from these, there are several other methods in seaborn that can give valuable information to us via plots. Check out the official documentation of seaborn if you want to learn more.
I hope his article was helpful. If you have any doubts, let me know in the comments.
I would appreciate it if you would be willing to share this post. It will encourage me to create more helpful tutorials like this.
Happy Coding!
Recent Posts
Modular programming is a software design technique that emphasizes separating the functionality of a program into independent, interchangeable modules. In this tutorial, let's understand what modular...
While Flask provides the essentials to get a web application up and running, it doesn't force anything upon the developer. This means that many features aren't included in the core framework....
